Business Intelligence And Reporting Tools Designer
About InetSoft's Report Designer for Efficient Report Design
Since 1996 InetSoft has been offering business intelligence applications that are flexible and powerful, serving over 5,000 enterprises and solution providers worldwide.
The first step in creating an application that is a true reporting and business intelligence solution, is designing reports. The reports will only be useful if the components used to create them have been designed to display data properly.
InetSoft's Style Report software (available stand-alone or as part of Style Intelligence, InetSoft's business intelligence software, provides many report elements that can display data through text and graphics. Tables, charts, and other advanced report components can all be used in a single report and modified with individual data binding, formatting, and display properties.
A traditional reporting tool leaves many problems without a solution. This article examines some of these problems below and demonstrates how Style Report offers a solution for each one.
Report Layout Problem:
Most reporting tools provide only a single report layout that does not allow a report designer to create a custom layout with elements placed in specific locations or that forces data to flow in a specified pattern.
The Style Report Solution
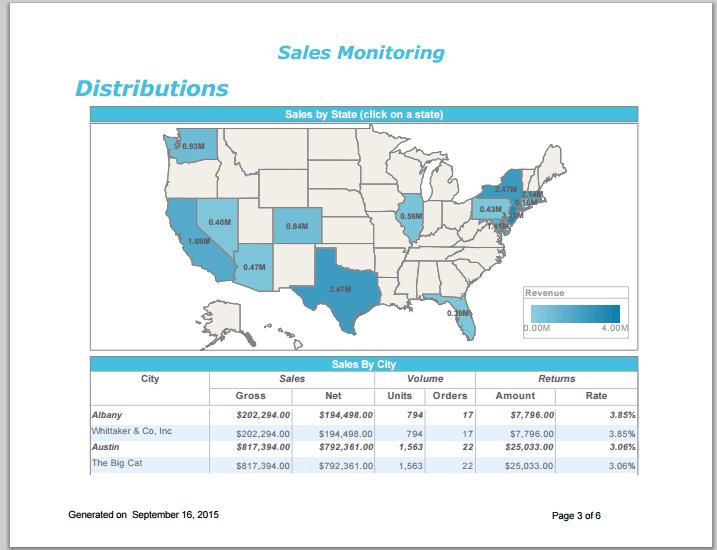
Style Report breaks the traditional report design paradigm by offering two different report layout types that allow report designers to place data elements into reports. The flow and tabular report layouts treat report elements and data differently and are suited to different situations. The flow layout treats a report like a word processor document. The report designer can place flow area into the report that directs the report elements to flow from one area to the next. There areas can be ordered to specify how data will flow. Using the flow layout, a report designer can create a report that has multiple columns or segmented areas that contain data.
The tabular report layout is unique to Style Report but resembles the layouts offered by most HTML development tools. Report designers can divide a report into cellular areas that each can contain report elements. The report designer enjoys a very fine grain of control using the tabular layout. Cells can be split into multiple rows and columns to place report elements anywhere within the report.
Report Elements Problem:
It is difficult to place data into reporting elements that can be customized to create a comprehensive report representing different types of data sets. There is also a need to supply each data element with its own data binding and display properties.
The Style Report Solution
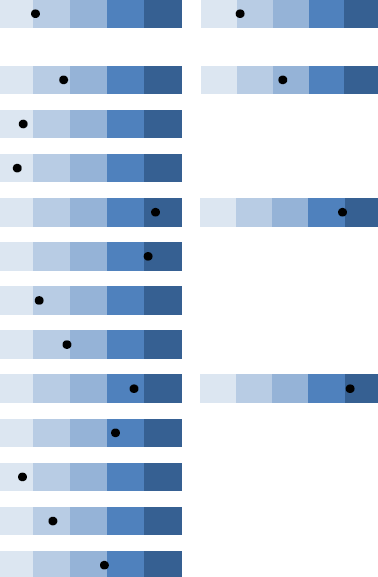
The main data elements used in all Style Report templates are tables, charts, and sections. Tables can display data in a standard row/column format, or in a multidimensional crosstab format. Style Report also provides the report designer with a freehand table element that can be modified to fit any dataset into a custom layout.
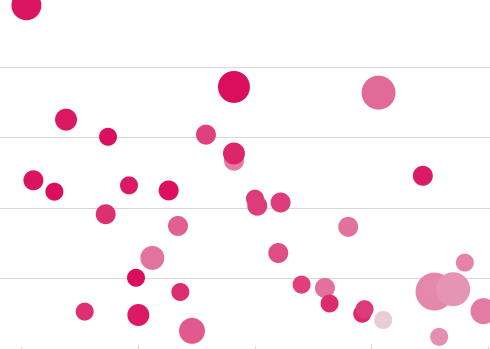
Style Report provides over 30 chart styles including bar, pie, line, curve, radar, waterfall, speedometer, pareto, candle, stock, stick, and bubble. These charts can be customized to show targets, provide desired x/y-axis formats and intervals, and even to show multiple datasets.
A section element is Style Report's answer to the banded report element that is present in other reporting tools. The section element is extremely versatile and will allow the report designer to create a very precise report layout through exact placement of report fields and control of how data is displayed or repeated. The section element is composed of header, content, and footer bands that each, handle data differently. The header band is displayed once for the entire dataset, the content band is repeated for each record in the dataset, and the footer band is shown once for the entire dataset (it differs from the header band in that it can contain summaries of the data). Sections can be nested to provide multiple levels of grouping and can even be linked from parent to child by a parameter value to create master-detail reports or sub-reports.
Every Style Report element is a self contained entity with its own data binding and display properties. This means that a report can have many different report elements each displaying a different data set with a different view.
 | Read what InetSoft customers and partners have said about their selection of Style Report as their production reporting tool. |
Grouping Summarization Problem:
Data must be displayed in a report element and grouped and summarized. The grouping should be available to as many levels as needed and the reporting solution should provide common aggregate function yet allow the report designer to create new ones.
The Style Report Solution
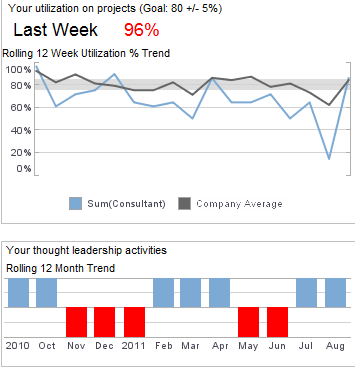
This is probably the most common problem that plagues report designers and forces them to look beyond simple tabular display of data using HTML or Java code. Style Report allows report designers to bind data to any report element and specify grouping and summary rules for every field displayed on that element. Data can be grouped to as many levels as needed and summarized using a built-in aggregate function such as sum, product, min, max, etc. Standard or custom groups can be specified as well. A time or date field can be grouped by intervals such as year, quarter, month, day, hour, etc. and customer named groups can be created to group data in a unique way.
Sub-reports Problem:
A simple reporting tool does not provide the ability to display data grouped in a hierarchy, using multiple report elements such as tables and charts.
The Style Report Solution
This problem goes beyond the simple need to display grouped and summarized data within a report element. When data needs to be related in a master/detail format, Style Report provides a sub-reporting feature that allows the report designer to embed one report within another and pass a parameter value from one report to the other to maintain category/detail association. A sub-report can be embedded within any report in the Report Designer by using a section element (described above). The sub-report can then be connected to the master report by one or more data fields. In the figures below, we can see a master report and two sub-reports that are connected through the "Product Category" field.
Java API and Java Scripting Problem:
Report elements sometimes need to be manipulated in ways that graphical design tools can not accommodate. Report designers need way to change data binding, display properties, etc. based on run-time conditions.
The Style Report Solution
Style Report provides a complete Java and scripting API for report customization and modification. Java developers can attain full control of the entire reporting system by using the Java API. The behavior of each reporting component and system module can be modified to meet the particular needs of that deployment. In fact, a report can be generated entirely at run-time if need be. The Java Script engine provides report designers with the toolset they need to modify reports at run-time without relying on the development of Java code that must be compiled. A simple or complex script can be put into any report to modify it in any way.
Report Design Summary:
Style Report is a very flexible, efficient reporting solution with regard to reusability and common element sharing between designer and developers. By providing reusable components such as meta-templates, report beans, parameter sheets, and a scripting library that can all be shared through a central component library, Style Report provides a flexible and robust solution for a development team of any size. These components will give developers the features they need while reducing development time and shortening time to market.
 | View a 2-minute demonstration of InetSoft's easy, agile, and robust BI software. |
Business Intelligence And Reporting Tools Designer
Source: https://www.inetsoft.com/company/report_design/
Posted by: wardhoulds.blogspot.com

0 Response to "Business Intelligence And Reporting Tools Designer"
Post a Comment